The graph layer
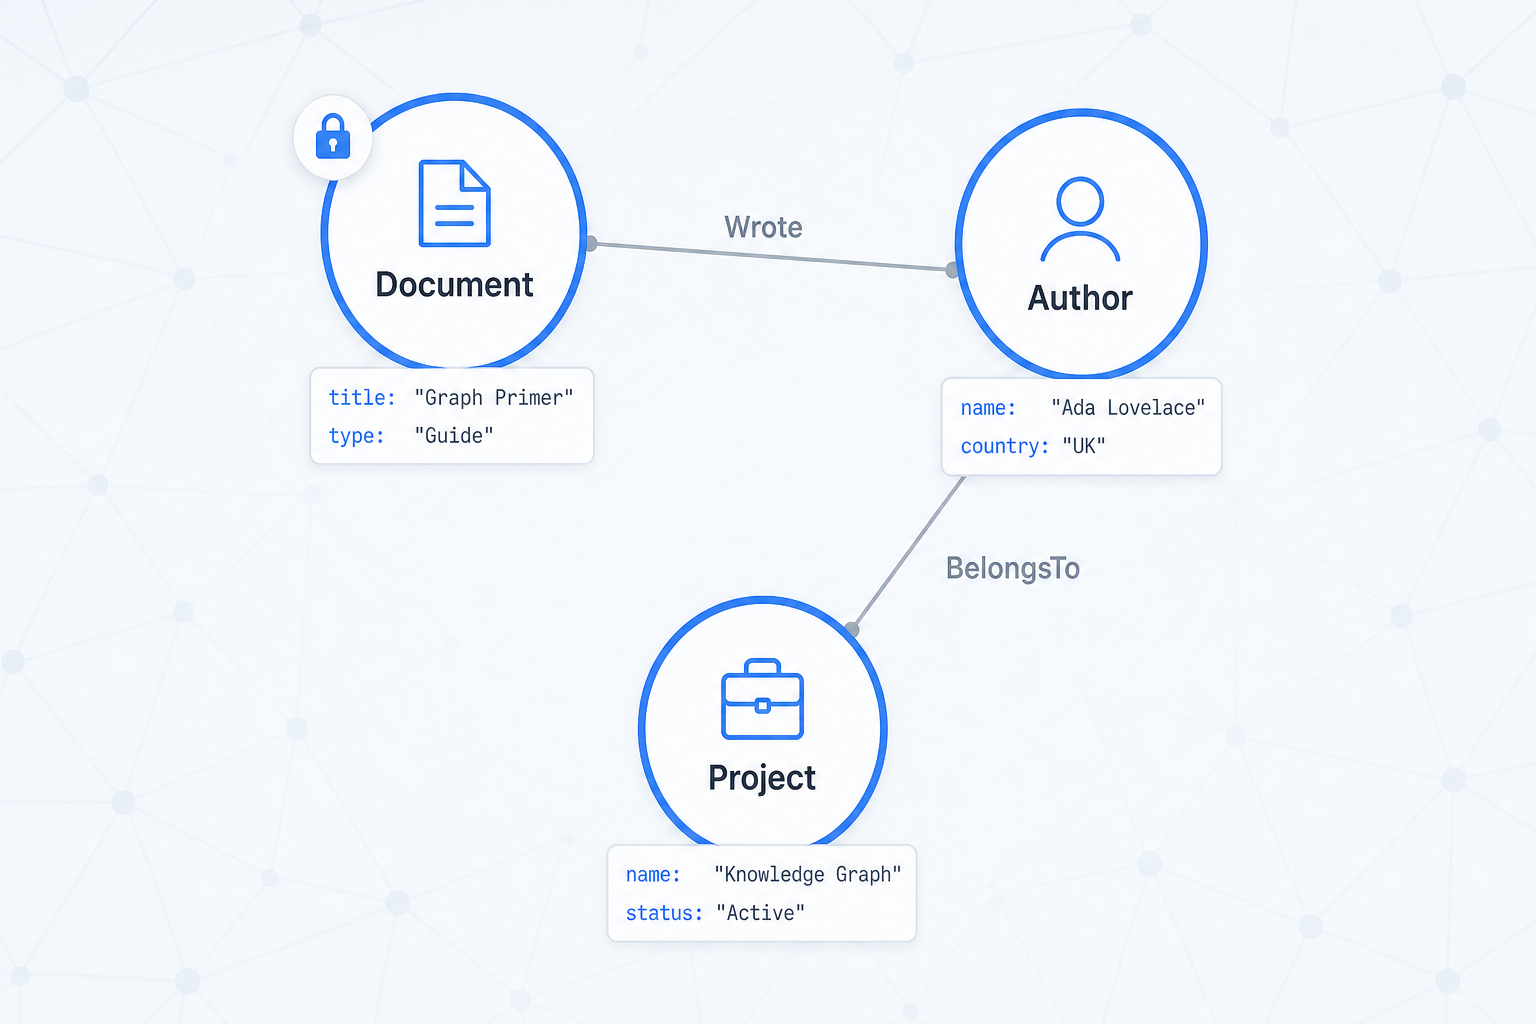
The graph is where your data lives. It's a typed, schema-driven property graph: nodes are entities, edges are relationships, properties are scalar fields.
flowchart LR
Author -->|Authored| Document
Document -->|BelongsTo| Project
Project -->|OwnedBy| Team
What the graph gives you:
- Navigation between entities ("all documents by this author")
- Faceting by relationship ("filter by project")
- Grounding for AI ("retrieve relevant nodes before asking the LLM")
- Access control — permissions live on graph nodes and propagate at query time
Access is relationship-based (ReBAC):
User → member of → Team → has access to → Node
A node with no restriction is visible to all authenticated users. Restrictions are set at ingestion time via RestrictAccessToTeam / RestrictAccessToUser.